Using the GR framework in JavaScript
As a C library GR can not only be used directly in C and C++ or with a wrapper in Python and Julia, but it can also be compiled using emscripten and used in JavaScript.
To use GR in JavaScript, you will need to include gr.js, which you can
either download
or build directly from the source code. You can then pass a function to
GR.ready(), which will be called once GR is loaded and ready for use.
Next you can create a GR object, which will expose an interface similar to the
API for the C library GR. This object will then draw onto a
canvas object identified by the ID specified during its creation or, if no ID
is passed to the call of new GR(), by the default ID canvas.
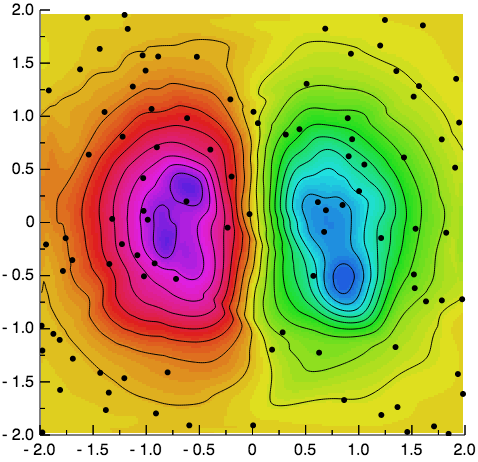
The following example shows how GR can be used in JavaScript to create a contour plot of unstructured two dimensional data:
<!doctype html>
<html lang="en-us">
<head>
  <meta charset="utf-8">
  <title>Grid data example using gr.js</title>
</head>
<body>
  <canvas id="example-canvas" width="500" height="500"></canvas>
  <script src="gr.js"></script>
  <script>
    GR.ready(function() {
      var gr = new GR('example-canvas');

      gr.setviewport(0.1, 0.95, 0.1, 0.95);
      gr.setwindow(-2, 2, -2, 2);
      gr.setfillintstyle(2);
      gr.setfillstyle(3);
      gr.setspace(-0.5, 0.5, 0, 90);
      gr.setmarkersize(1);
      gr.setmarkertype(-1);
      gr.setcharheight(0.024);
      gr.settextalign(2, 0);
      gr.settextfontprec(3, 0);

      var xd = new Array(100);
      var yd = new Array(100);
      var zd = new Array(100);
      for (var i = 0; i < 100; i++) {
          xd[i] = -2 + 4.0 * Math.random();
          yd[i] = -2 + 4.0 * Math.random();
          zd[i] = xd[i] * Math.exp(-xd[i] * xd[i] - yd[i] * yd[i]);
      }
      var result = gr.gridit(100, xd, yd, zd, 200, 200);
      var x = result[0];
      var y = result[1];
      var z = result[2];
      gr.surface(200, 200, x, y, z, 5);

      var h = new Array(20);
      for (var i = 0; i < 20; i++) {
          h[i] = -0.5 + i / 19.0;
      }
      gr.contour(200, 200, 20, x, y, h, z, 0);
      gr.polymarker(100, xd, yd);
      gr.axes(0.25, 0.25, -2, -2, 2, 2, 0.01);
    });
  </script>
</body>
</html>
Compared to including static PNG images, the key advantage of using GR in JavaScript is that you can create images and animations at runtime, allowing interactivity and the client-side visualization of live data.
The following example uses GR with window.requestAnimationFrame()
to draw an animated plot of (random) live data:
// Set up x and y values
var x = new Array(201);
var y = new Array(201);
for (var i = 0; i < 201; i++) {
  x[i] = 2 * i / 200;
}
y[0] = 0;
for (var i = 1; i < 201; i++) {
  y[i] = 0.9*y[i-1] + 0.4 * Math.random() - 0.2;
}

GR.ready(function() {
  var gr = new GR('example-canvas');

  function onFrame() {
    // Update x and y values
    for (var i = 0; i < 200; i++) {
      y[i] = y[i+1];
      x[i] = x[i+1];
    }
    y[200] = 0.9*y[200] + 0.4* Math.random() - 0.2;
    x[200] = x[199] + 0.01;

    // Draw new frame
    gr.clearws();
    gr.setviewport(0.1, 0.95, 0.1, 0.95);
    gr.setwindow(x[0], x[200], -1, 1);
    gr.grid(0.25, 0.25, 0, 0, 2, 2);
    gr.axes(0.25, 0.25, x[0], -1, 2, 2, 0.005);
    gr.axes(0.25, 0.25, x[200], 1, -2, -2, -0.005);
    gr.polyline(200, x, y);
    gr.textext(0.37, 0.97, "Plot Animation Demo");
    gr.textext(0.5, 0.01, "x");
    gr.textext(0.01, 0.525, "y");

    // Request to be called for the next frame
    window.requestAnimationFrame(onFrame);
  };
  window.requestAnimationFrame(onFrame);
});