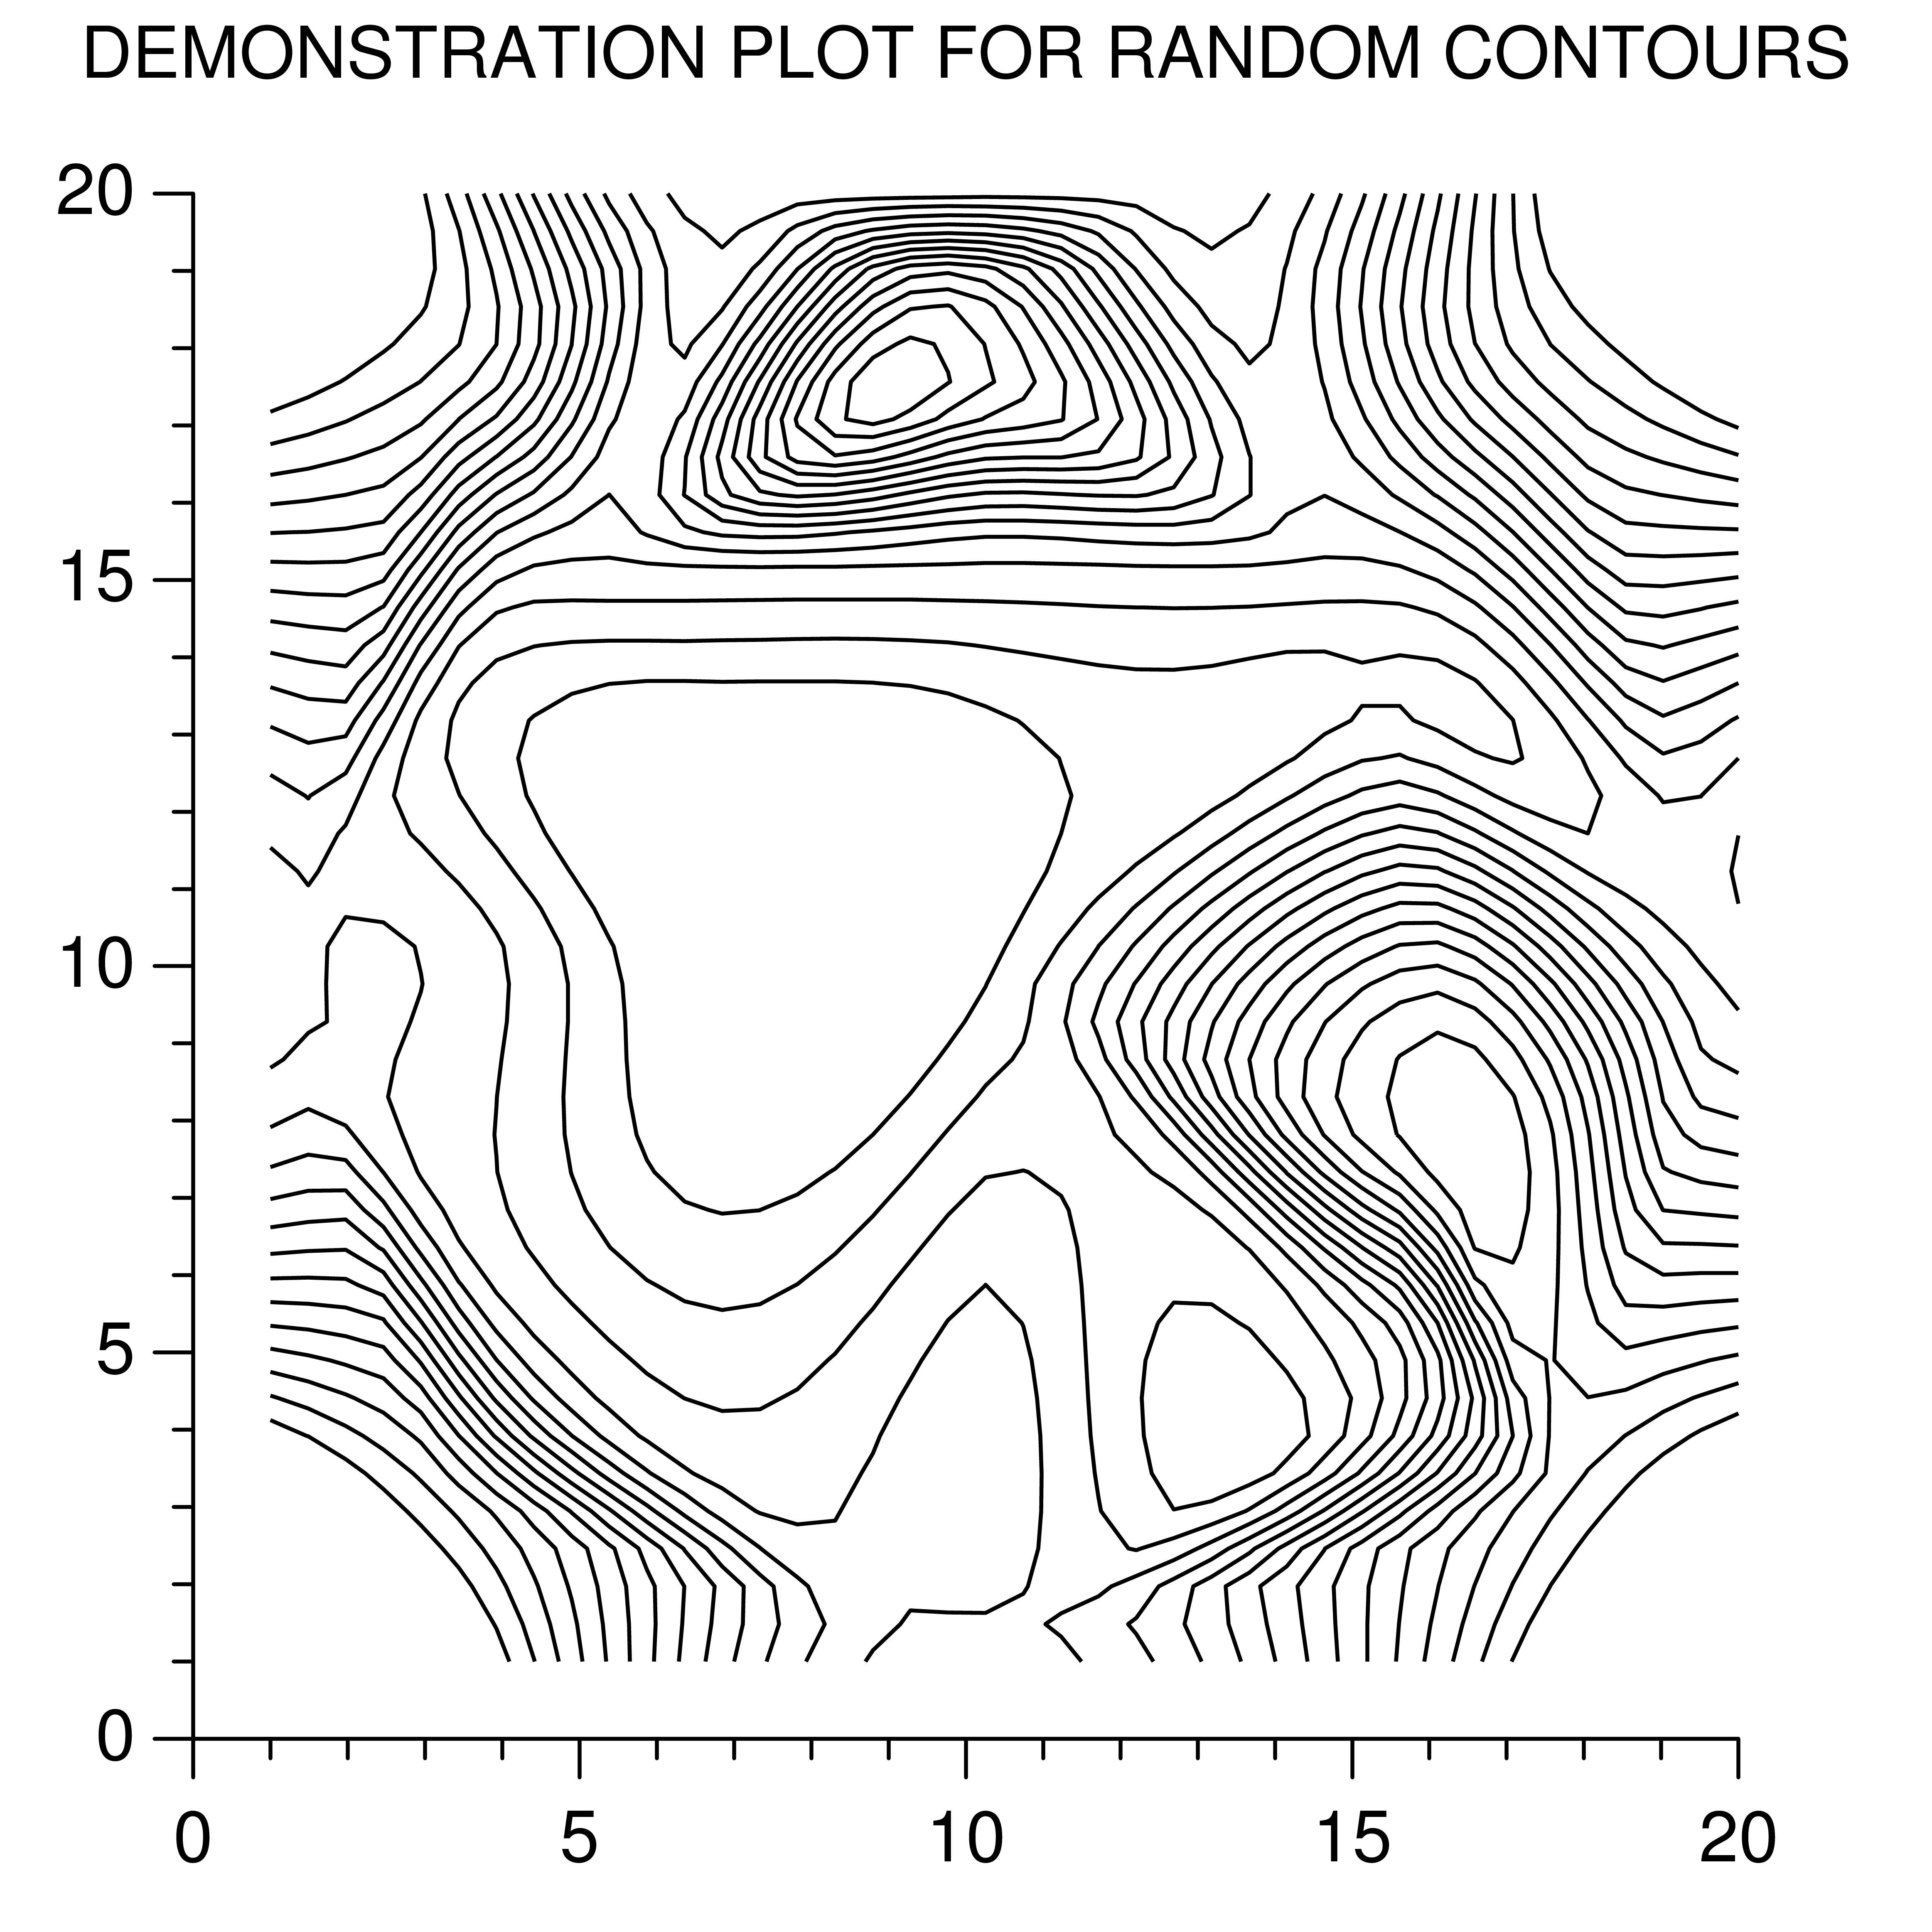
rancon
Plot irregular distributed data
from gr.pygr import *

xd = [3, 3, 10, 18, 18, 10, 10, 5, 1, 15, 20, 5, 15, 10, 7, 13, 16]
yd = [3, 18, 18, 3, 18, 10, 1, 5, 10, 5, 10, 15, 15, 15, 20, 20, 8]
zd = [25, 25, 25, 25, 25, -5, 1, 1, 1, 1, 1, 1, 1, 1, 1, 1, 25]

gr.setviewport(0.1, 0.9, 0.1, 0.9)
gr.setwindow(0.0, 20.0, 0.0, 20.0)
gr.setcharheight(0.027)
gr.settextalign(2, 0)
gr.settextfontprec(3, 0)
gr.text(0.5, 0.96, 'DEMONSTRATION PLOT FOR RANDOM CONTOURS')
gr.selntran(1)
gr.setspace(-10.0, 40.0, 0, 90)
gr.axes(1.0, 1.0, 0.0, 0.0, 5, 5, -0.01)
gr.setwindow(0, 20, 0, 20)
gr.setspace(-10, 40, 0, 90)

x, y, z = gr.gridit(xd, yd, zd, 40, 40)
h = range(-4, 28, 2)
gr.contour(x, y, h, z, 0)

gr.updatews()